- We put the best of the "simple" signals to the test: a VIX indicator that cuts exposure when volatility rises, moving capital into a safe haven (cash, bonds, gold, commodities, defensive sectors).
- The signal really works as protection: max drawdown cut from −55.2% to −47.4%, worst year from −36.8% to −22.5%, and it beats both random exposure cuts and a "diluted" Buy & Hold at equal risk.
- But on raw returns it doesn’t beat the market: 9.94% a year vs. 10.71% for Buy & Hold. None of the ten variants tested gets there. Starting from $100,000: $610,000 vs. $698,000.
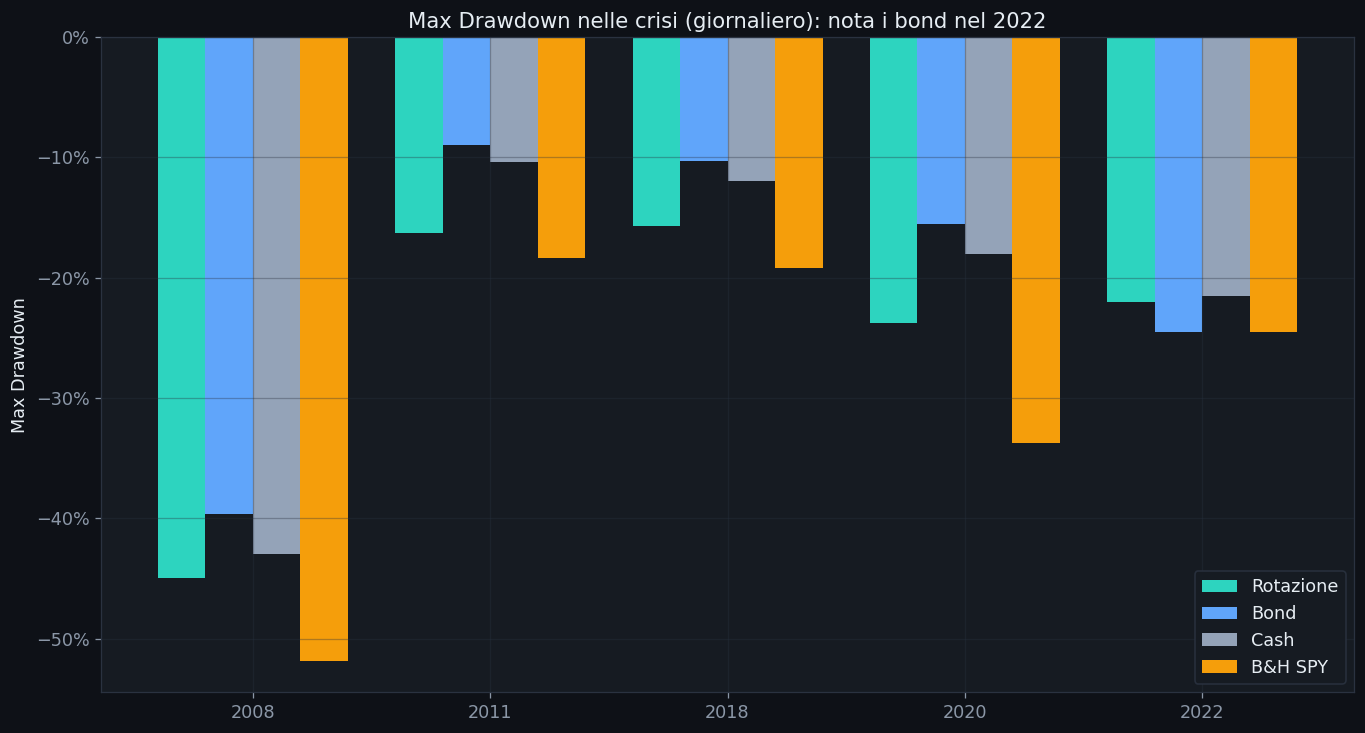
- No safe haven is universal: in 2022, bonds — the "textbook" safe haven — crashed right along with stocks (−24.5%, same as the market). The best safe haven that year? Plain cash.
- The honest lesson: simple rules manage risk; they don’t generate excess returns. The evidence suggests that to truly do better, you need complex rules and active management.
"Can you beat Buy & Hold with a simple rule?" Sooner or later, every investor asks this question: one indicator, a moving average, a VIX threshold — a shortcut you can remember and apply effortlessly. In a previous study we tested six momentum strategies on 33 years of data: none beat the market on returns. But that test left a legitimate objection open: "those strategies just get out. What if, instead of sitting in cash, you moved the capital into a smart safe haven?"
This study answers exactly that objection. We built the most serious contender we could among simple methods: a soft volatility signal, a full menu of safe havens declared in advance, and even an automatic rotation that picks the best safe haven of the moment on its own. Then we ran it through checks you rarely see on finance blogs: a placebo test with 300 random simulations and a risk-matched comparison. We’ll give away the conclusion up front, because it’s the thesis of this article: even the best of the simple methods manages risk but doesn’t beat the market on returns.
How the test is built (and why every choice was made)
The starting portfolio is as classic as it gets: $100,000 invested in SPY, the S&P 500 ETF, from 2007 to today — 4,810 trading days that include 2008, Covid and 2022. We apply a single rule to this portfolio:
- When volatility rises (a risk signal), we cut equity exposure by 50% and move the freed-up half into a safe haven;
- When volatility subsides, we go back to being 100% invested in SPY.
Every detail was chosen to make the test honest, not to make it look better:
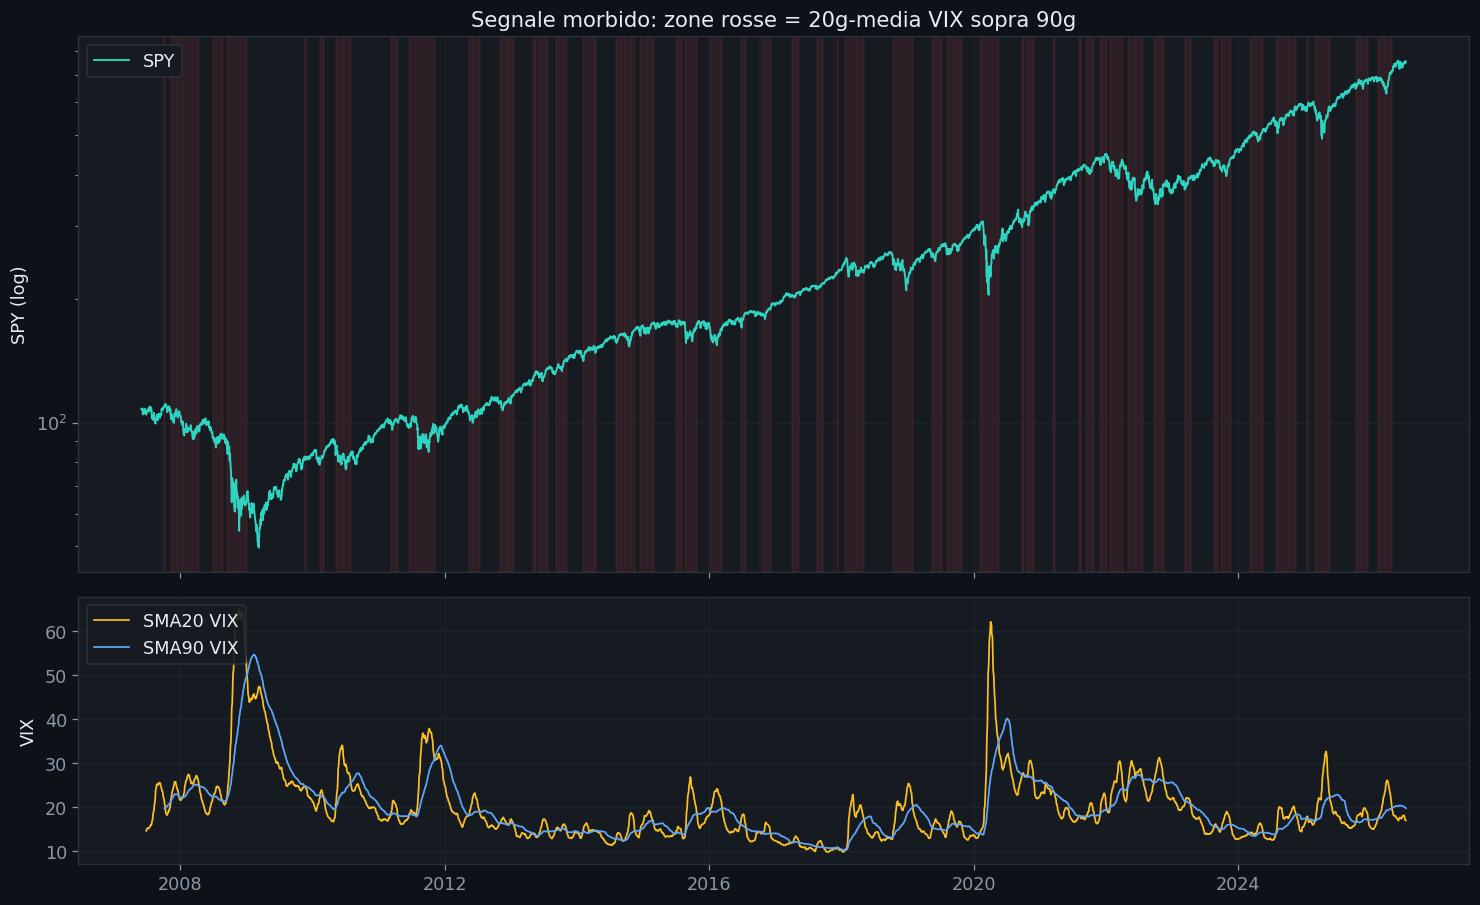
- The signal is "soft": the 20-day average of the VIX above its 90-day average. Why these? Because they require no optimization at all: they’re the most natural way to say "recent volatility is higher than normal." And because they only use the VIX, which has existed since 1990, so 2008 is included in the test.
- Exposure is cut by 50%, not eliminated: getting completely out of the market is a recipe for missing the rebounds. A partial reduction is more realistic and less jittery.
- The signal is read today and executed tomorrow: no hindsight. In real life, nobody can buy at the closing price of the day the signal fires.
- Every trade pays a cost of 5 basis points (0.05%), and drawdowns are calculated day by day, not at month-end: losses can’t "hide" between two observations.
- The safe-haven menu is declared up front and reported in full, losers included: no cherry-picking, i.e. no "I’ll only show you what worked."
The VIX is the index of expected volatility on the S&P 500: it measures how much "movement" traders expect over the next 30 days, derived from option prices. It rises when there’s fear and falls when things are calm — which is why it’s nicknamed "the fear index." Comparing its 20-day average with its 90-day average amounts to asking: is recent fear above its normal level?
Here’s what the signal looks like on the SPY chart: the highlighted bands are the periods when the strategy is in "defense" mode. Notice how compact and persistent they are: the moving-average filter avoids the constant in-and-out (the infamous whipsaw) that plagues jumpier indicators. Overall, the strategy is in defense mode on 39.3% of days.
The real question: when you cut back, where does the money go?
Reducing risk is half the job. The other half is deciding where the freed-up capital goes, and opinions abound: "bonds, obviously," "gold, it always protects you," "cash, it never lets you down." Instead of picking a favorite, we tested the whole menu, declaring it in advance:
- Cash (BIL): ultra-short-term US Treasuries, the parking spot for liquidity;
- Bonds (IEF): 7–10 year US Treasuries, the "textbook" safe haven;
- Gold (GLD): the safe-haven asset par excellence;
- Commodities (DBC): the inflation hedge;
- Defensive sectors (XLU/XLP/XLV): utilities, consumer staples, health care — stocks that "swing" less;
- Diversified blend: an equal-weight mix of all the safe havens;
- Adaptive rotation: every month it automatically picks the safe haven with the strongest momentum over the last 63 days. No opinions required: it follows relative strength.
And for comparison, two benchmarks: pure Buy & Hold on SPY and — far trickier — a "risk-matched" Buy & Hold: a portfolio that always holds 85.9% in SPY and the rest in cash, built to have roughly the same drawdown as the strategy. It answers the uncomfortable question: "does all this work pay more than a plain diluted portfolio?"
The verdict in four boxes
The safe-haven menu: no universal winner
Here are all the variants, with the same signal and the same rigor. The key columns are annual return, Sharpe (return per unit of risk) and max drawdown:
| Safe haven | What it does | Annual ret. | Sharpe | Sortino | Max drawdown | Worst year | $100k grows to… |
|---|---|---|---|---|---|---|---|
| Adaptive rotation ★ | Every month it moves the defense into the safe haven with the strongest momentum. | 9.94% | 0.60 | 0.84 | −47.4% | −22.5% | $610k |
| Diversified blend | Equal-weight mix of all the safe havens. | 9.29% | 0.57 | 0.80 | −49.0% | −26.4% | $545k |
| Cash only (BIL) | The defensive half stays in interest-bearing cash. | 8.41% | 0.55 | 0.76 | −46.7% | −22.5% | $467k |
| Bonds only (IEF) | The defensive half goes into 7–10 year US Treasuries. | 9.17% | 0.60 | 0.85 | −42.8% | −21.9% | $534k |
| Gold only (GLD) | The defensive half goes into gold. | 10.52% | 0.63 | 0.89 | −46.5% | −20.9% | $675k |
| Commodities only (DBC) | The defensive half goes into commodities. | 7.62% | 0.43 | 0.59 | −58.1% | −38.6% | $406k |
| Defensive sectors | The defensive half goes into utilities, consumer staples and health care. | 10.23% | 0.56 | 0.78 | −52.5% | −32.8% | $642k |
| Buy & Hold SPY | Buy and hold: always invested, does nothing. | 10.71% | 0.54 | 0.76 | −55.2% | −36.8% | $698k |
| B&H risk-matched | 85.9% SPY + cash: same risk as the strategy, zero signals. | 9.61% | 0.54 | 0.76 | −48.9% | −31.7% | $576k |
Three things jump out. First: no safe haven beats Buy & Hold on returns — not even gold, which comes closest (10.52%). Second: every safe haven comes at a price. Gold has the highest Sharpe (0.63) and the mildest worst year; bonds have the smallest max drawdown (−42.8%); commodities destroy value overall (7.62% a year with a −58.1% drawdown, worse than the market!). Third: defensive sectors return a lot but they’re still stocks — when everything crashes, they crash too (−32.8% in the worst year).
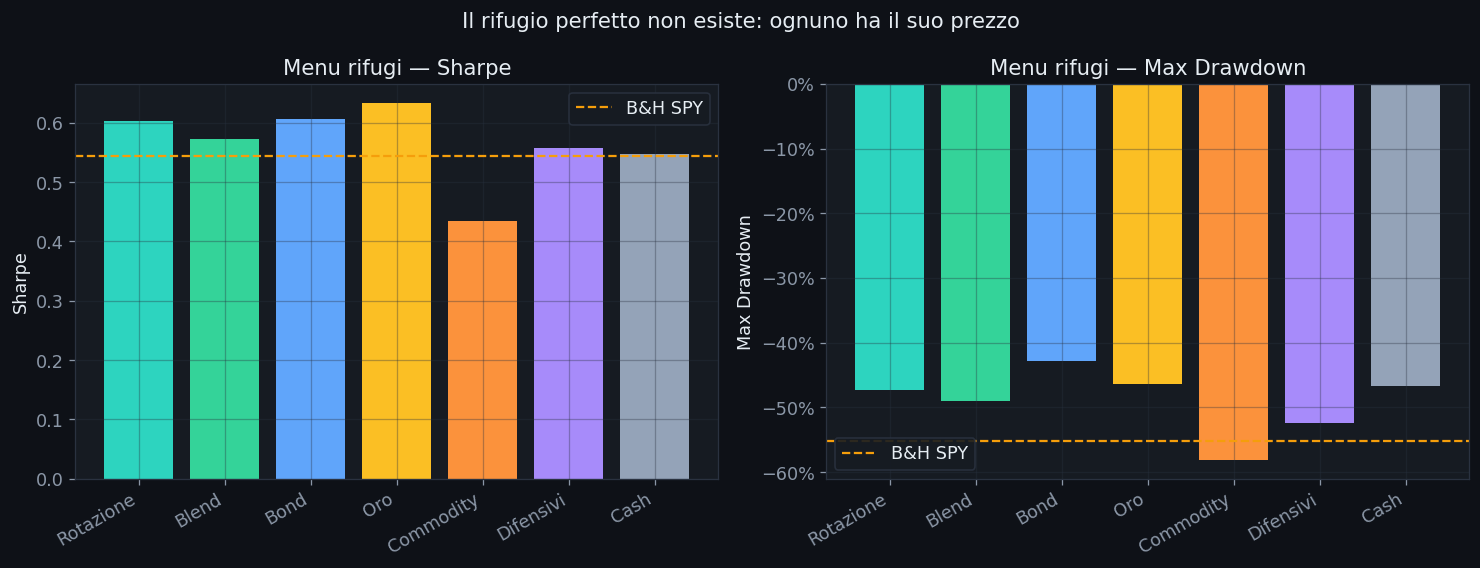
$100,000 grows to how much?
The most concrete measure: what the capital would have grown to with each variant, from 2007 to today.
Where the value shows (and where the limit does)
The next two charts tell the whole story better than a thousand words. The first is capital growth: the strategy (highlighted) loses ground during long bull runs — the stretches when it’s half out of the market because of false alarms — and wins it back all at once during crashes, when the defense pays off.
The second is the "underwater" chart: how far below the previous high you are, day by day. It’s the chart of pain, and here the strategy dominates: shallower and shorter time underwater. After 2008, Buy & Hold stayed below its high for 58 consecutive months — almost five years; the strategy, 39 at most.
Drawdown is the decline from the previous high: going from 100 to 45 is a −55%. For a real investor it’s often the deciding number, because it determines whether you hold on psychologically or sell at the worst possible moment. A −55% requires a +122% just to break even; a −47% "only" needs +89%. And then there’s time: spending almost five years below your high wears you down more than the loss itself.
What does each safe haven add? The "with and without" test
To understand the contribution of each building block, we rebuilt the diversified blend removing one safe haven at a time. It’s an honest attribution, not an optimization: it measures how much each ingredient moves the result.
| Block removed | Blend without it (ret. / Sharpe) | Contribution to return | Contribution to Sharpe | Contribution to max DD |
|---|---|---|---|---|
| Bonds (IEF) | 9.30% / 0.56 | −0.01% | +0.011 | +1.5 points |
| Gold (GLD) | 8.94% / 0.55 | +0.35% | +0.025 | +0.7 points |
| Commodities (DBC) | 9.67% / 0.60 | −0.38% | −0.030 | −2.0 points |
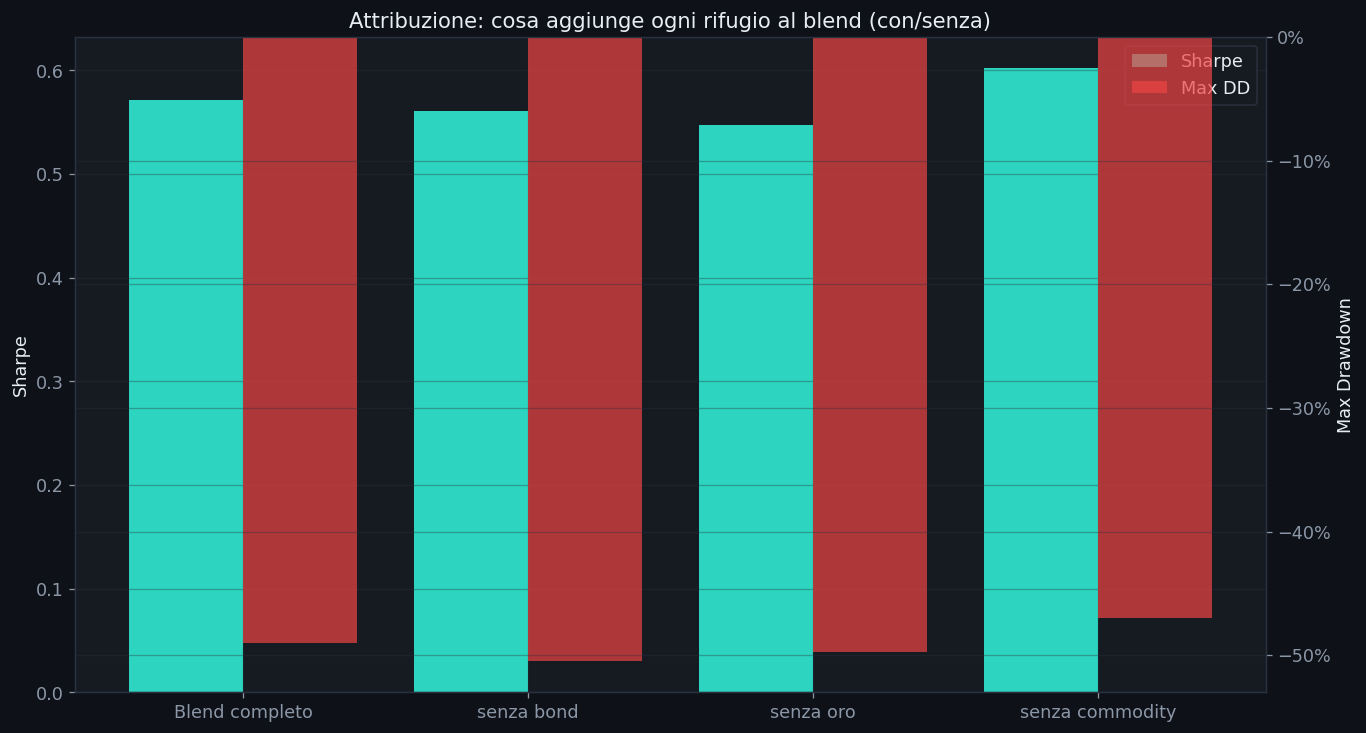
The result hides a logical trap that’s very easy to fall into: "commodities subtract value, so I’ll drop them." On average, that’s true. But as we’ll see shortly, commodities are exactly what saves 2022 — the year every other safe haven lets you down. The average cost of an insurance policy tells you nothing about how much you’ll need it in any single fire.
The moment of truth: what if it’s just luck?
Here comes the check that separates a serious study from a social-media backtest. Anyone who cuts exposure 39% of the time will necessarily have smaller drawdowns: they’re simply taking less risk. The right question is a different one: does the VIX signal pick the right moments, or would a random calendar do just as well?
To answer it, we built a placebo: 300 simulations that cut exposure with exactly the same frequency as the signal (39.3% of days), but at randomly chosen times. If the real strategy didn’t do better than the placebo cloud, the signal would have no value at all.
| Metric | Placebo (mean) | Placebo p05 | Placebo p95 | Real strategy | Above the 95th percentile? |
|---|---|---|---|---|---|
| Annual ret. | 3.93% | 1.75% | 6.26% | 9.94% | YES ✓ |
| Sharpe | 0.23 | 0.11 | 0.35 | 0.60 | YES ✓ |
| Max drawdown | −50.2% | −59.9% | −39.8% | −47.4% | NO ✗ |
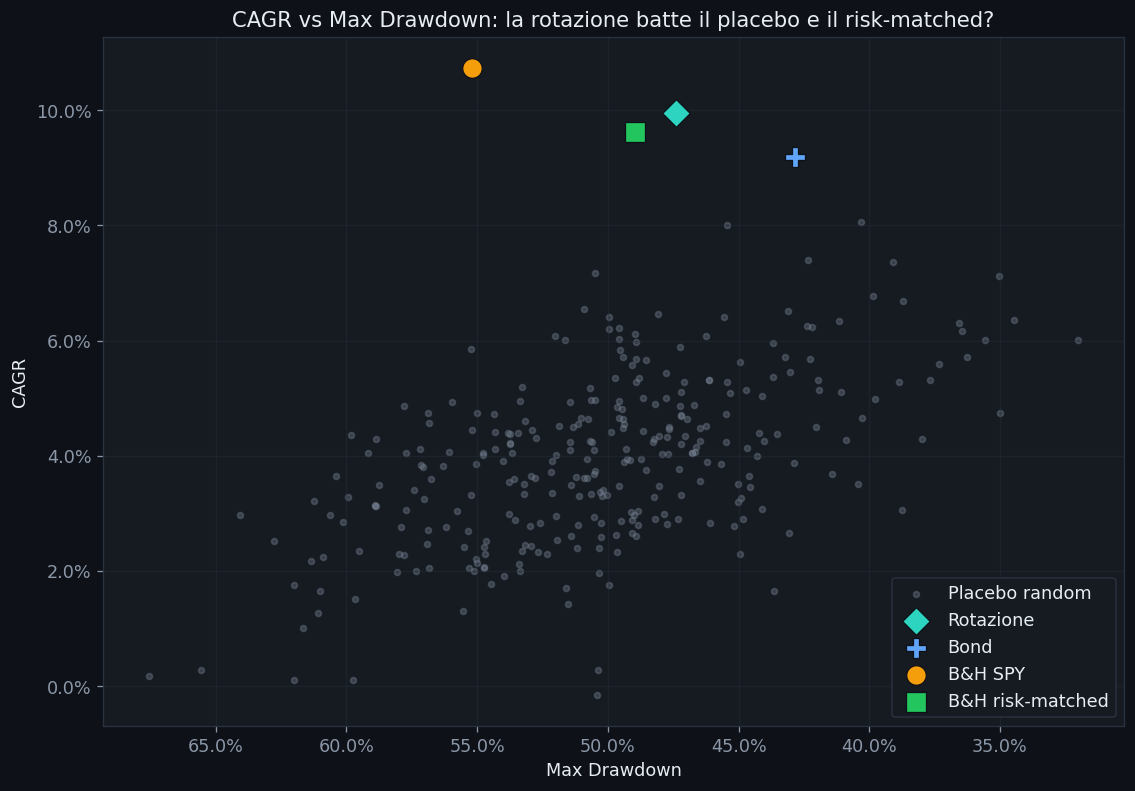
The result is clear-cut on return and Sharpe: the real strategy sits outside the distribution of chance. Cutting exposure at random returns 3.93% a year on average; cutting it when the VIX says so returns 9.94%. So the signal really does pick the right moments to play defense.
The second check: does it beat a "diluted" portfolio?
With the placebo test passed, the most elegant objection remains: "you don’t need any signal to get less risk — just buy fewer stocks." Fair enough. That’s why the final comparison is against the risk-matched Buy & Hold: 85.9% SPY and cash for the rest, constant, never touched — a portfolio with roughly the same drawdown as the strategy.
| Portfolio | Annual ret. | Volatility | Sharpe | Max drawdown | Months underwater (max) | $100k grows to… |
|---|---|---|---|---|---|---|
| Buy & Hold SPY | 10.71% | 19.8% | 0.54 | −55.2% | 58 | $698k |
| B&H risk-matched (85.9% SPY) | 9.61% | 17.0% | 0.54 | −48.9% | 53 | $576k |
| Adaptive rotation ★ | 9.94% | 15.3% | 0.60 | −47.4% | 39 | $610k |
At equal risk, the strategy wins across the board: higher return (9.94% vs. 9.61%), better Sharpe (0.60 vs. 0.54), less time underwater (39 months vs. 53) and $34,000 more at the finish line. The signal adds real value compared with "just buy fewer stocks." But mind the hierarchy, because it’s the heart of this article: the strategy dominates the scaled-down Buy & Hold — not the full Buy & Hold, which remains unbeaten on absolute returns.
The lesson of 2022: when the "textbook" safe haven lets you down
Five crises run through the test: 2008, 2011, 2018, 2020 and 2022. In four out of five, the script is the usual one — the strategy absorbs the blow much better than the market. But 2022 deserves a chapter of its own, because it proved the textbook wrong.
| Strategy | 2008 | 2011 | 2018 | 2020 | 2022 |
|---|---|---|---|---|---|
| Buy & Hold SPY | −51.9%year: −34.8% | −18.4%year: −3.8% | −19.2%year: −13.5% | −33.7%year: −3.2% | −24.5%year: −18.2% |
| Adaptive rotation | −45.0%year: −21.7% | −16.3%year: −7.3% | −15.7%year: −10.9% | −23.8%year: −0.7% | −22.0%year: −16.4% |
| Safe haven: cash only | −43.0%year: −21.2% | −10.4%year: −1.5% | −11.9%year: −8.7% | −18.1%year: +2.3% | −21.5%year: −19.1% |
| Safe haven: bonds only | −39.7%year: −15.6% | −9.0%year: +3.5% | −10.3%year: −6.7% | −15.5%year: +6.0% | −24.5%year: −21.9% |
| Safe haven: gold only | −42.8%year: −19.7% | −9.4%year: +8.4% | −9.3%year: −5.5% | −20.3%year: +7.1% | −23.6%year: −19.2% |
| Safe haven: commodities only | −58.1%year: −36.6% | −17.1%year: −2.7% | −21.0%year: −17.8% | −29.6%year: −8.8% | −23.5%year: −14.1% |
What happened? In 2022, inflation forced central banks to hike rates aggressively, and stocks and bonds fell together — something the "60/40 playbook" considered almost impossible. Anyone who had built their defense on bonds found out the insurance didn’t cover that particular kind of fire. Adaptive rotation limited the damage (−22.0%) because momentum had moved it into commodities and gold, out of bonds, with no macro forecasting needed.
If you don’t want to pick a safe haven: let momentum decide
Adaptive rotation is the practical answer to the "which safe haven do I pick?" problem: none — you keep them all on the menu and every month the strongest one wins. Here’s where it put the defense over these 19 years:
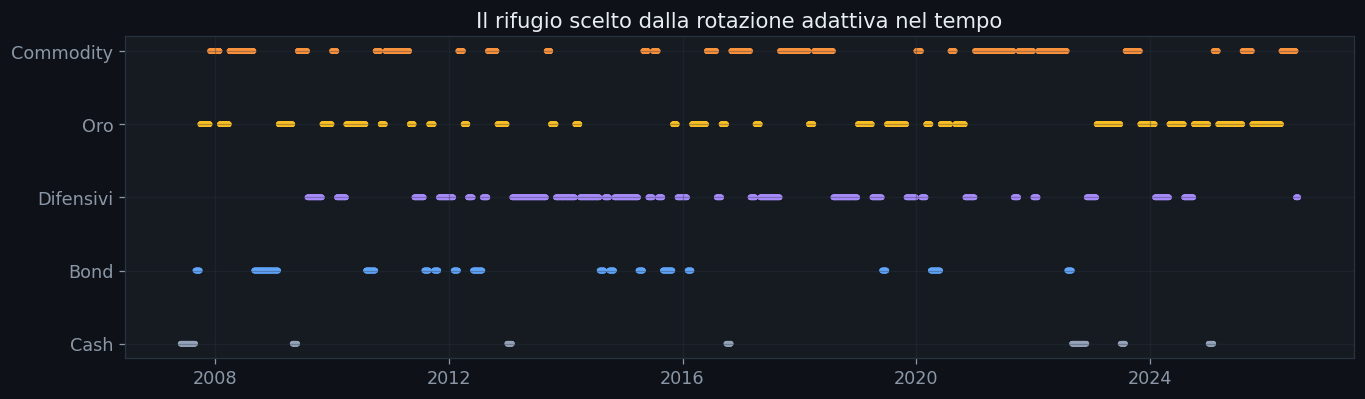
Let’s be clear: the rotation is not the safe haven with the best metrics overall — gold on its own has a higher Sharpe (0.63 vs. 0.60). But gold alone is a bet: you have to pick it in advance, and stick with it even when it isn’t working. The rotation is the robust compromise: it doesn’t require you to guess the macro regime of the next twenty years, and in crises it almost always picks a decent safe haven. That’s why we named it the study’s "best simple method."
Four lessons from the data
1 · Even the best simple method doesn’t beat the market on returns
Ten variants, a sensible signal, safe havens of every kind: none reaches the 10.71% of Buy & Hold. The best one (adaptive rotation) stops at 9.94%, paying a toll of 0.78 points a year. Over 19 years that adds up to $88,000 on $100,000 invested. The evidence converges: the value of simple rules is defensive, not offensive.
2 · But the defensive value is real — and it isn’t luck
Max drawdown from −55.2% to −47.4%, worst year from −36.8% to −22.5%, almost two fewer years spent underwater. And the checks hold up: the strategy beats 300 random placebos on return and Sharpe, and dominates a diluted Buy & Hold at equal risk. The VIX signal really does pick the right moments to play defense.
3 · No safe haven is universal
Bonds protect in 2008 and 2020 and let you down in 2022. Commodities destroy value for 15 years, then rescue 2022 of all years. Gold is the best on average but has to be chosen in advance. Anyone promising you the right safe haven is looking at a single crisis. Adaptive rotation sidesteps the problem: it doesn’t predict, it chases strength.
4 · Less risk doesn’t turn into more return
It’s the most common misconception: "I cut my drawdowns, so with compounding I’ll beat the market." The numbers say no: every day spent at 50% exposure during a rally is lost return, and the false alarms (the signal is in defense mode on 39% of days, while real crises are far fewer) eat up the edge built during the crashes. On risk, the math works; on absolute return, it doesn’t.
So, what should I choose?
Buy and hold, if…
- your only goal is to maximize long-term returns
- you have the stomach for a −55% and five years underwater without selling
- you want zero maintenance, zero signals, lower costs and taxes
A simple exposure-reduction signal, if…
- a −50% would make you panic-sell (the real risk for most investors)
- you accept earning a bit less in exchange for much shorter crashes and recoveries
- you prefer safe-haven rotation to betting on a single safe haven
- you know from the start that you won’t beat the market: you’re buying insurance, not a money machine
And to really beat the market?
That’s the question we started with, and the honest answer is: not with a shortcut. We tested a set of simple, popular methods — not every possible one, so the conclusion is inductive, not a theorem — but the evidence converges clearly, and it’s consistent with what we had already seen with momentum strategies: a single rule sees only one dimension of the market, and the cost of its false alarms eats up its return advantage.
What the evidence points to is that beating the market takes a different craft altogether: multi-rule, multi-asset systems, active position management, disciplined rebalancing, diversification across signals, instruments and time horizons — the kind of ongoing work we described when discussing algorithmic trading and its life cycle. Not a textbook rule, but a process.
How we ran the numbers
In plain English. Data: SPY (S&P 500 with dividends reinvested) and the official Cboe VIX, from 2007 through July 2026 — the first year and a half is used to "warm up" the moving averages. Signal: VIX 20-day average above its 90-day average; when active, equity exposure drops to 50% and the freed-up half goes into the safe haven. Adaptive rotation: every month it picks the safe haven with the strongest 63-day momentum. Methodological honesty: the signal is read at yesterday’s close and executed today, every trade pays 5 basis points, drawdowns are calculated day by day, and the safe-haven menu is declared up front and reported in full. Checks: 300 placebos with random exposure cuts at the same frequency, and a Buy & Hold scaled down to equal risk. The study comes from an analysis notebook developed in Python on real data (Cboe + EODHD).
Conclusions
We set out asking whether a simple rule can beat Buy & Hold, and we gave the simple rule every possible advantage: the most sensible signal, a complete safe-haven menu, even an automatic rotation that chooses on its own. The result is an honest draw: on risk, the rule wins — and it truly wins, not by chance, as the placebo test and the equal-risk comparison show. On returns, the market wins, every time, against all ten variants. If you’re looking for protection, you’ll find a serious, verified tool here; if you’re looking to beat the market with a shortcut, you’ll find a closed door — and the evidence suggests that opening it takes complex rules and active management. A different craft, in other words.
This article is also available in Italian.