- Automated trading is systematic trading executed by a machine: coded rules, running on a server that is up 24/7.
- More than 90% of the systems developed fail out-of-sample validation: overfitting is the rule, not the exception.
- Before going live, a system needs an incubation period: anywhere from 6 months to 2–3 years, depending on how often it trades.
- The model portfolio: 3 systems × 20 stocks = 60 combinations, with a point-in-time semi-annual rotation and sizing at 1/60 of capital.
- Survival rule: a system that loses 2–3 times its historical maximum gets pulled and put in quarantine.
To me, algorithmic trading — which here also means automated trading — is a specific branch of systematic trading. Systematic trading is simply a way of trading based on strict adherence to precise rules defined in advance. It can be run manually — for example with hybrid option/underlying systematic strategies — or automatically, through trading systems that are coded and executed by a machine (in this case, a PC).
What platforms do you need for automated trading?
Automated trading, the way I practice it, relies on dedicated platforms installed on a Windows server that runs 24/7. I have always used two: TradeStation, as my data provider and often for development too, and MultiCharts, mainly as my production and execution platform.
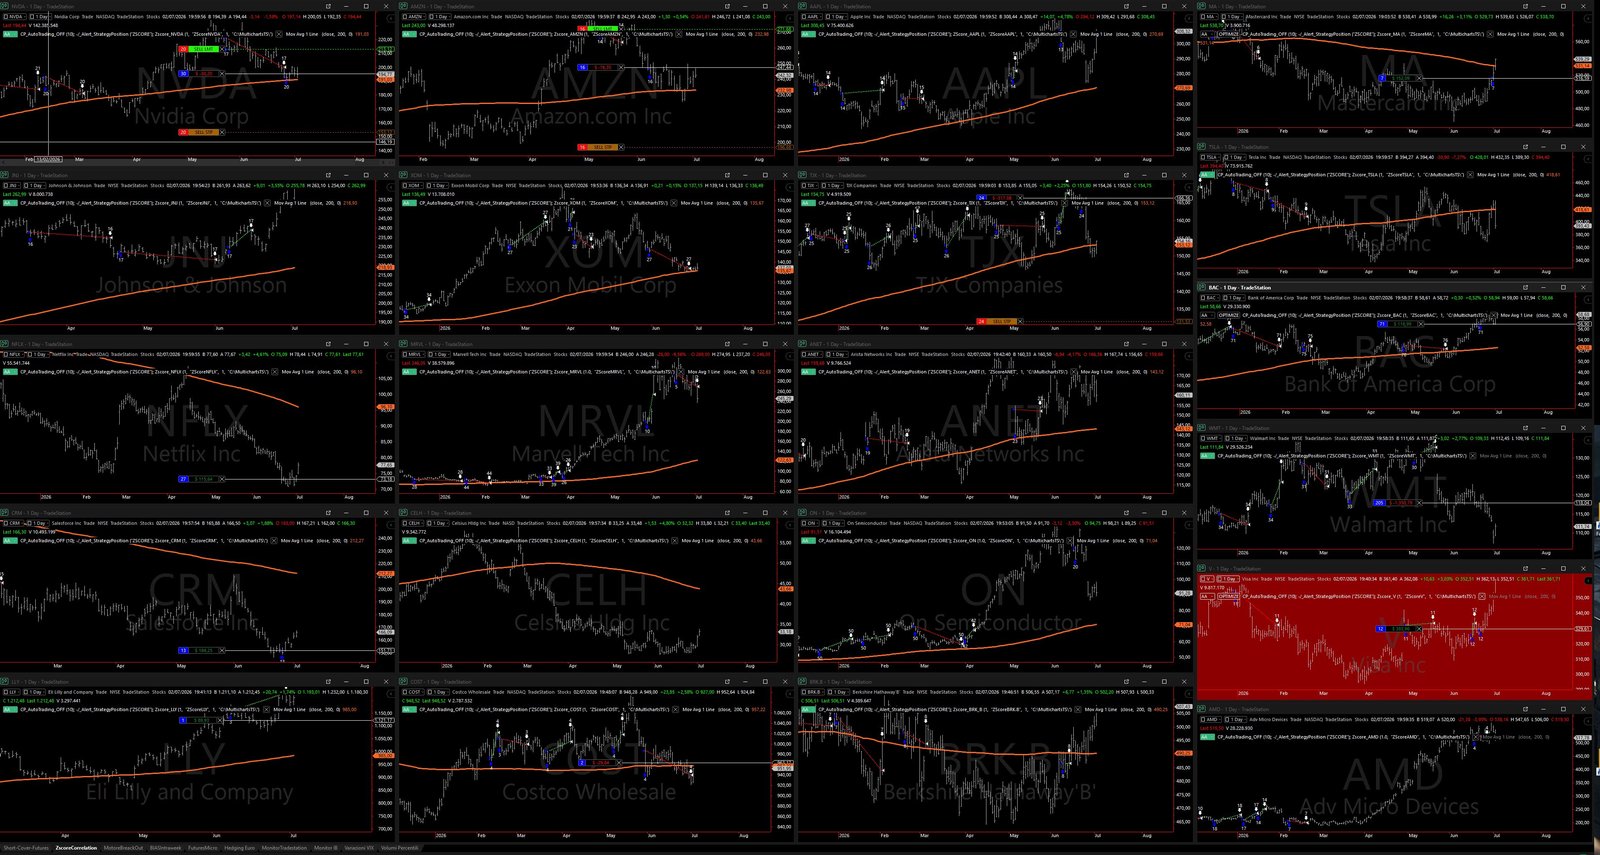
Another component that defines automated trading, as I see it, is the post-production phase: purpose-built Python applications that analyze volatility regimes, correlation metrics and the rotation of the instruments traded. I call it "post-production" because it comes into play after you've decided which systems to run on a live account, and on which underlyings.
How a trading system is born: research and development
Building an automated trading operation necessarily goes through distinct phases. The first is research and development: identifying and coding — in my case in EasyLanguage for TradeStation or PowerLanguage for MultiCharts — the set of rules and instructions the machine will then apply to price charts in real time, to the letter.
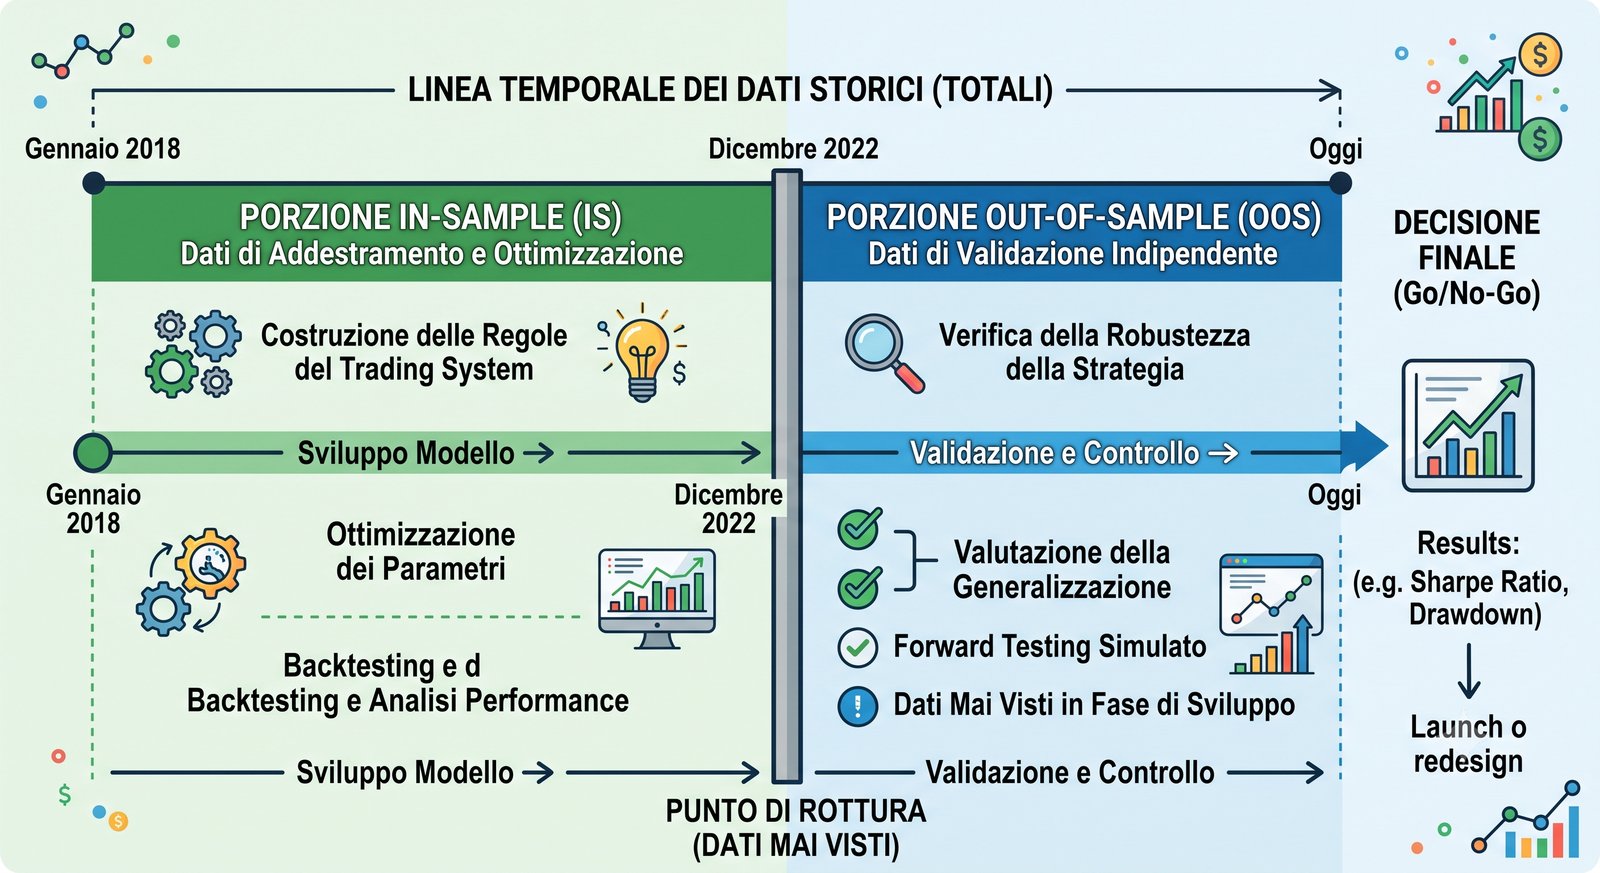
The search for these rules is largely subjective and varies from trader to trader. In many cases people proceed by trial and error, applying rules derived from traditional technical analysis, indicators and oscillators. Personally, I prefer to start from statistical tests that can capture the big-picture behavior of the asset I'm studying, using the smallest possible fraction of the historical data I have available.
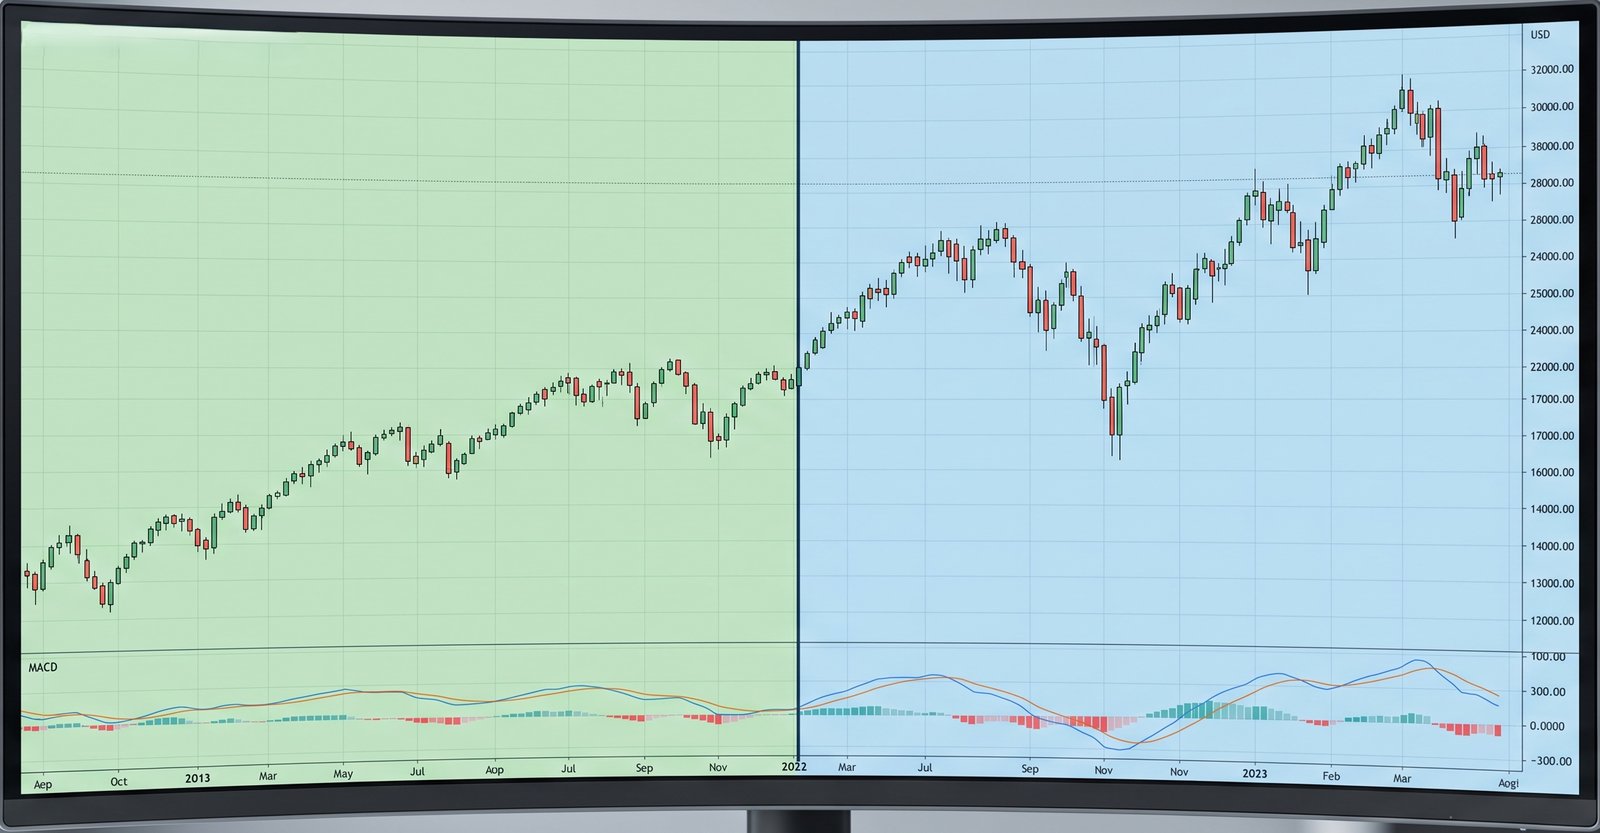
From there, still working only on that slice of data, I build out the rules. Once I'm satisfied with the result, I apply the coded rules to data that has never been analyzed before, called out-of-sample — as opposed to the earlier data, called in-sample.
Overfitting: why more than 90% of systems end up in the trash
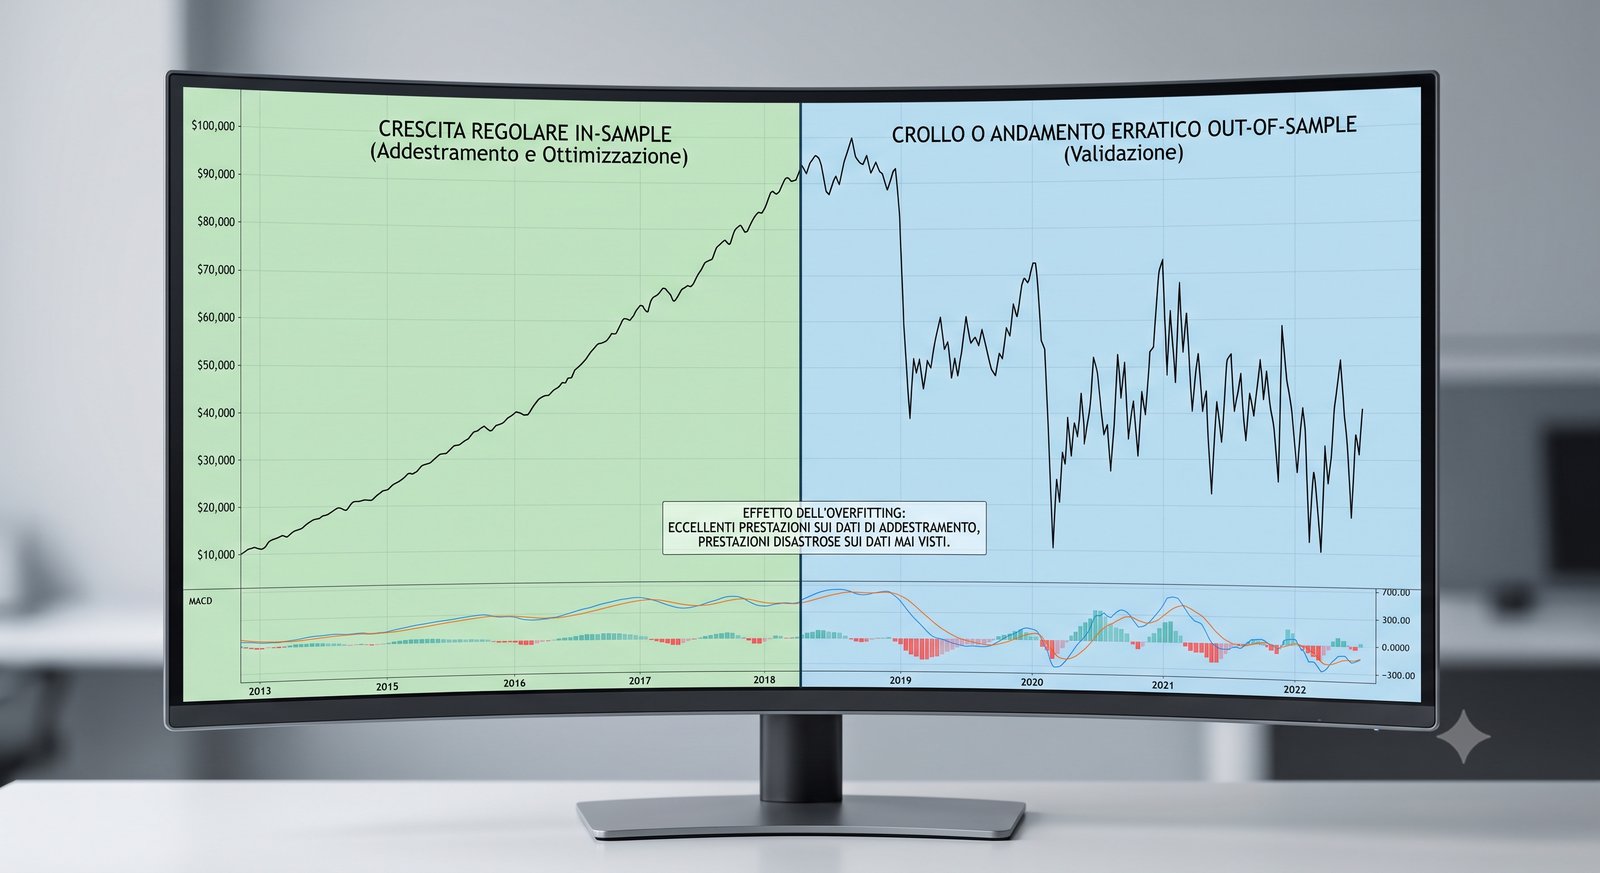
This step is the source of one of the biggest frustrations for systematic traders who run automated algorithms: very often more than 90% of the work simply gets thrown away, because the out-of-sample data doesn't confirm what was found in-sample. This is what's called overfitting: optimizing so aggressively on historical data that the results can't be replicated going forward — small changes in the behavior of the underlying or of the market are enough to reveal those results as completely spurious. Over the past few years I've developed dozens of systems of every kind, but very few have passed every test — including the test of time — the way the systems in the model portfolio we offer have.
Incubation: the real-market test
On those rare occasions when you land in the fabled 5% — something that keeps working out-of-sample much like it did in-sample — you can move forward with the research, without altering the coded rules in any way. From this point on there are several paths, and every trader has their own way of using the coded rules. In most cases you switch the trading system on in the platform and keep it in incubation for a set period: you let it trade the market in real time to see whether it maintains the consistency and results it showed both in-sample and out-of-sample.
How long this period lasts depends on the time frame and on how many trades the system makes: it's decided case by case and varies a lot. On average, for trading systems that trade fairly often — trades just a few days apart — 6 months of incubation may be enough; for particularly slow systems, perhaps on a daily time frame with few trades, it can take a year, or even two or three.
The three systems in the model portfolio
The trading systems in our model portfolio — the one we offer as a service — were built exactly the way I've just described. There are three: a trend-following breakout system, a mean-reversion system based on a Z-Score applied to a specific moving average, and one that exploits day-of-week biases on carefully selected tickers among the largest-cap names in the S&P 500.
Breakout
Enters on breakouts and rides the trend. Few trades, applied to 20 stocks.
Moving-average Z-Score
Buys statistical weakness below the average. Short, frequent trades, on 20 stocks.
Day-of-week biases
Exploits intra-week patterns calibrated stock by stock, on 20 stocks.
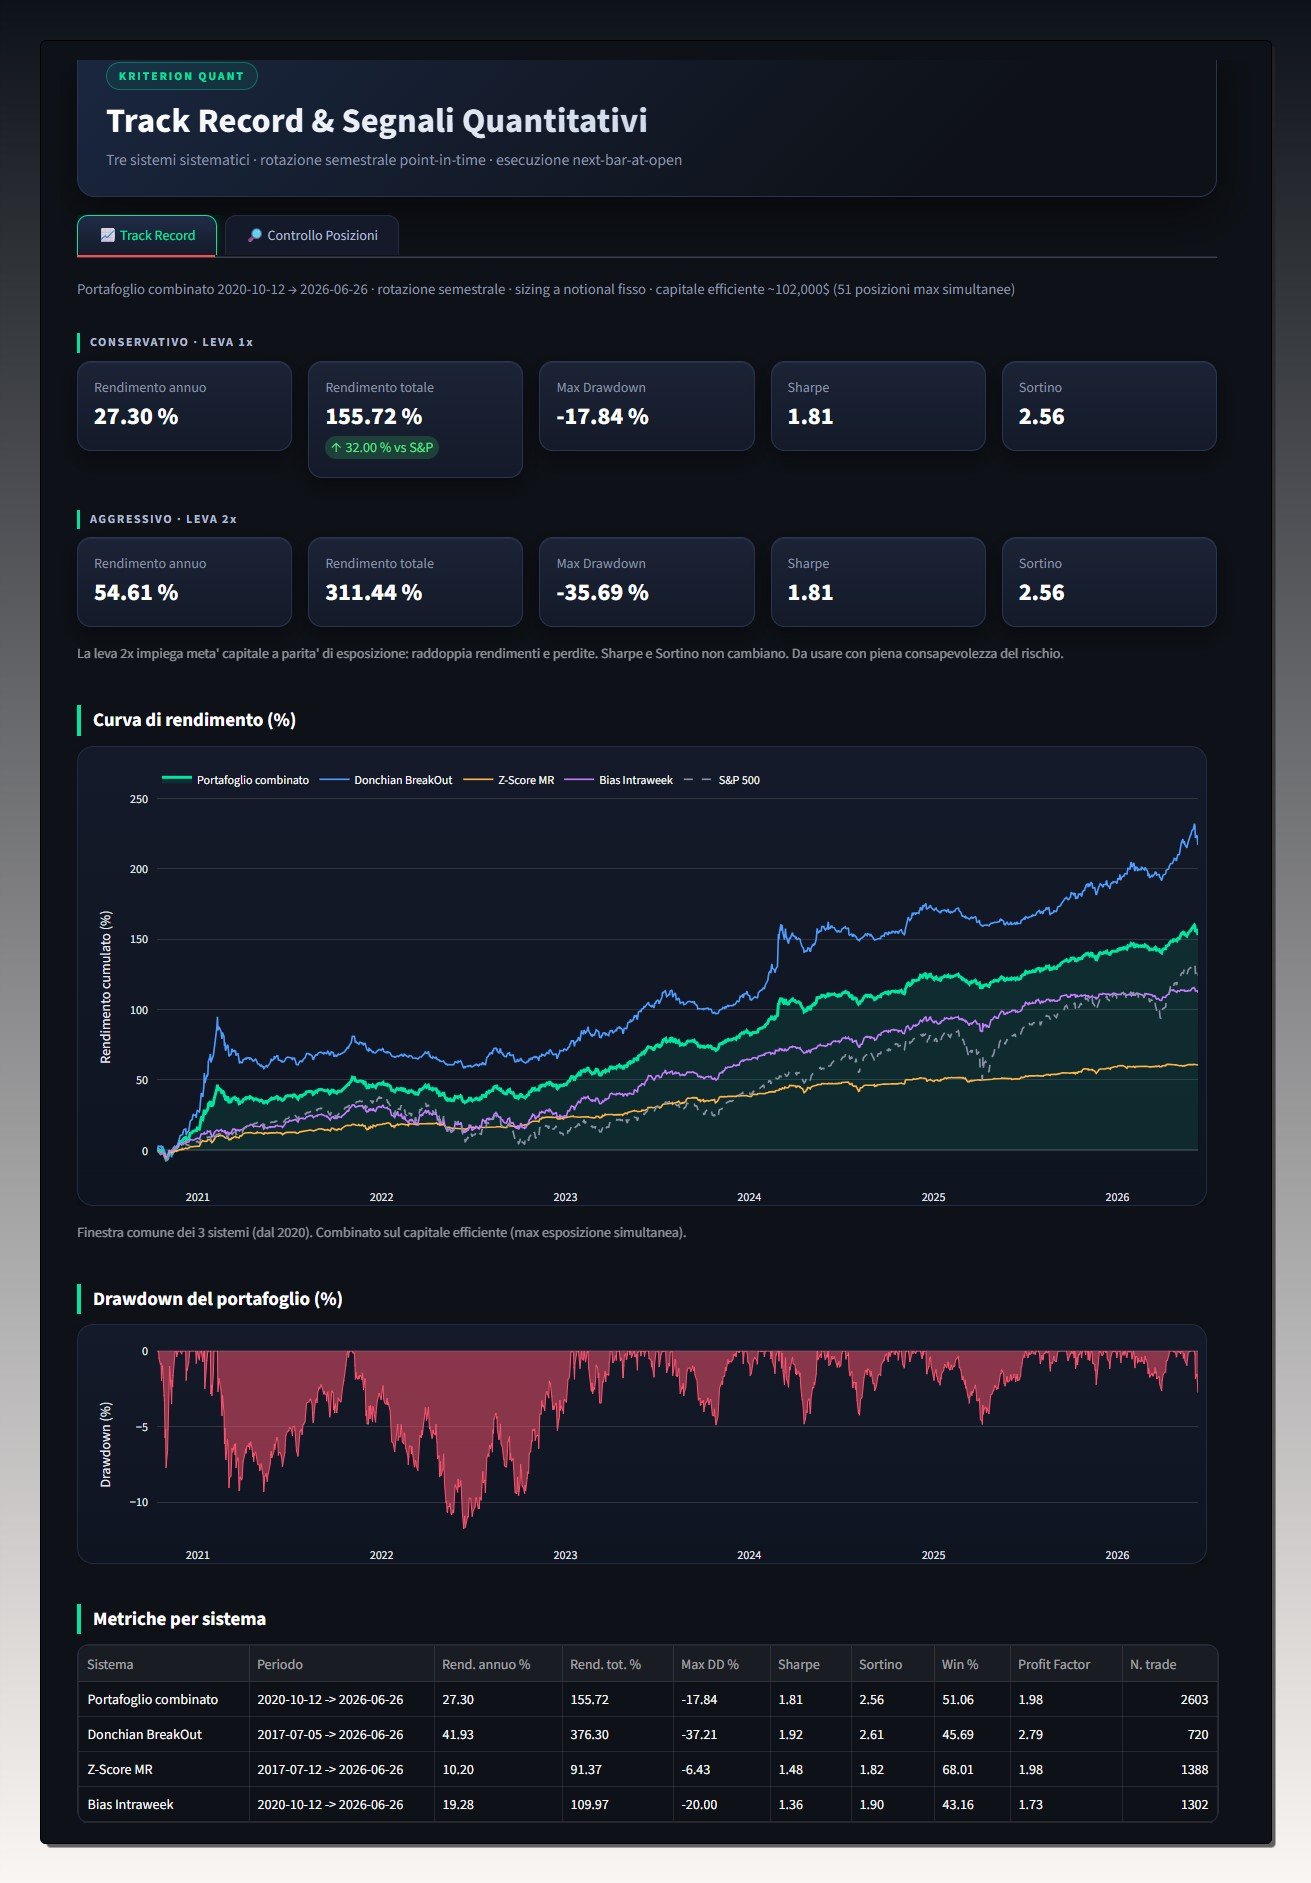
These three classes of trading systems, each applied to twenty stocks at the same time, weren't chosen at random: they tend to offset one another. The drawdown of the combined portfolio — that is, the maximum loss of the three systems taken together — comes out smaller than the drawdown of the worst individual system. That's why all three need to run together: it's the combination that makes up the model portfolio, with metrics you can follow in real time on the dedicated dashboard.
Semi-annual rotation and point-in-time testing
On top of that, the stocks in the three trading systems — sixty in total — are rotated every six months, based on statistical models that take into account both performance metrics and correlation metrics, with the goal of keeping the three systems consistent and balanced. This rotation is run by Python models that simulate, in-sample, completely random selections as a benchmark for the model's selection rules, and check whether, out-of-sample, the statistical selection rules deliver better performance than picking tickers at random.
An important clarification, because this is where many backtests lie: the rotations are calculated point-in-time. Each semi-annual selection uses only the information available on that date — not today's winners projected back into the past. Otherwise you would introduce so-called survivorship bias: testing in the past the stocks we already know turned out to be winners, artificially inflating the results. It's one of the first things I check in any backtest, mine or anyone else's. Broadly speaking, these are the rigorous processes I routinely apply to my automated trading.
When a trading system "breaks": monitoring and quarantine
The last phase in running automated trading systems is monitoring and, if needed, deciding to put a system on standby. This is a very personal part of the process. It can happen that a trading system stops working as expected; figuring that out, however, is very hard, and there's no universal method (as with everything else, really). As a rule of thumb, you could use this: if the trading system produces a maximum loss equal to twice (or three times) its historical maximum loss, it's time to pull it from the account and put it in a sort of quarantine.
At that point, the trading system can go one of two ways: 1) it starts to recover and make money again (but we've pulled it, so we've only booked the loss); 2) it's completely broken — the underlying has totally changed its nature — and it can no longer make money. In the first case you evaluate whether to put it back in the market; in the second, you throw it out, and that's that.
This happens more often with specific underlyings such as futures — commodities, equity indices, forex and so on: they do break, and by the time we notice and decide to act, the damage to the account is often already done. That's why most of my activity is focused on equity trading systems. First: by splitting capital across 60 stock-system combinations of different kinds, if a few systems break they can never do visible damage to the account. Second: it's extremely unlikely that several trading systems of different kinds, on very different underlyings, break at the same time and cause obvious damage to the account. Third: every 6 months the rotation process automatically benches any underperforming systems, effectively minimizing the potential damage from the odd loose cannon. Remember that a single combination out of 60 accounts for 1/60 of total exposure: even if, absurdly, 10 or 15 of them broke at once, their negative contribution would still be a fraction of the total capital deployed.
Position sizing: how much capital per trade?
From here — as you may have guessed by now — we move on to position sizing, i.e. how much capital I commit to each trade of a single trading system. Here I use a very simple calculation. Assuming 1x leverage, I divide the total capital allocated to algorithmic trading by 60. Historically, all three trading systems have never been in the market on all 60 stocks at the same time; but as a precaution, since it could happen, it's better to use this conservative calculation. In some particularly favorable periods I tend to go to 2x leverage using a margin account — which, to be clear, also doubles the risk: in that case I use twice the capital for each trade.
| Allocated capital | Leverage | Capital per position (÷60) |
|---|---|---|
| €15,000 | 1x | €250 |
| €30,000 | 1x | €500 |
| €30,000 | 2x (margin account) | €1,000 |
Conclusions
Research on a fraction of the data, out-of-sample validation, live-market incubation, monitoring with quarantine rules, conservative sizing: none of these steps guarantees anything on its own. It's the full chain that makes the difference between a promising backtest and a trading operation that holds up in the real market. That's the process. The results, updated daily, are on the public dashboard: checking them costs nothing.
This article is also available in Italian.